Engineering Health Report Documentation
The goal of this page is to help you interpret your Engineering Health Report. The Turbolytics Engineering Health Report is generated based on data contained in your version control GitHub. The metrics contained in the report are metrics our consultants find critical to debug the performance of engineering teams.
Approach - Why Pull Requests?
Software-based companies integrate code to modify their products often making Pull requests the lowest common denominator of work and collaboration at software companies. Pull requests contain rich data which can indicate how teams work, who is working, and properties of that work.
Engineering Health Report Metrics
The Engineering Health Report analyzes signals inside of pull requests to understand:
- Velocity: The rate of code integration.
- Size: The size of the work integrated.
- Duration: The amount of time it takes to integrate code.
- Waste: The amount of discarded code.
- Capacity: The amount of pending work.
- Team: The people involved in creating, reviewing and integrating code.
Interpreting Your Report
The Engineering Health Report contains 3 sections:
- Health Report Card
- Insights
- Historic Metric Analysis
Health Report Card
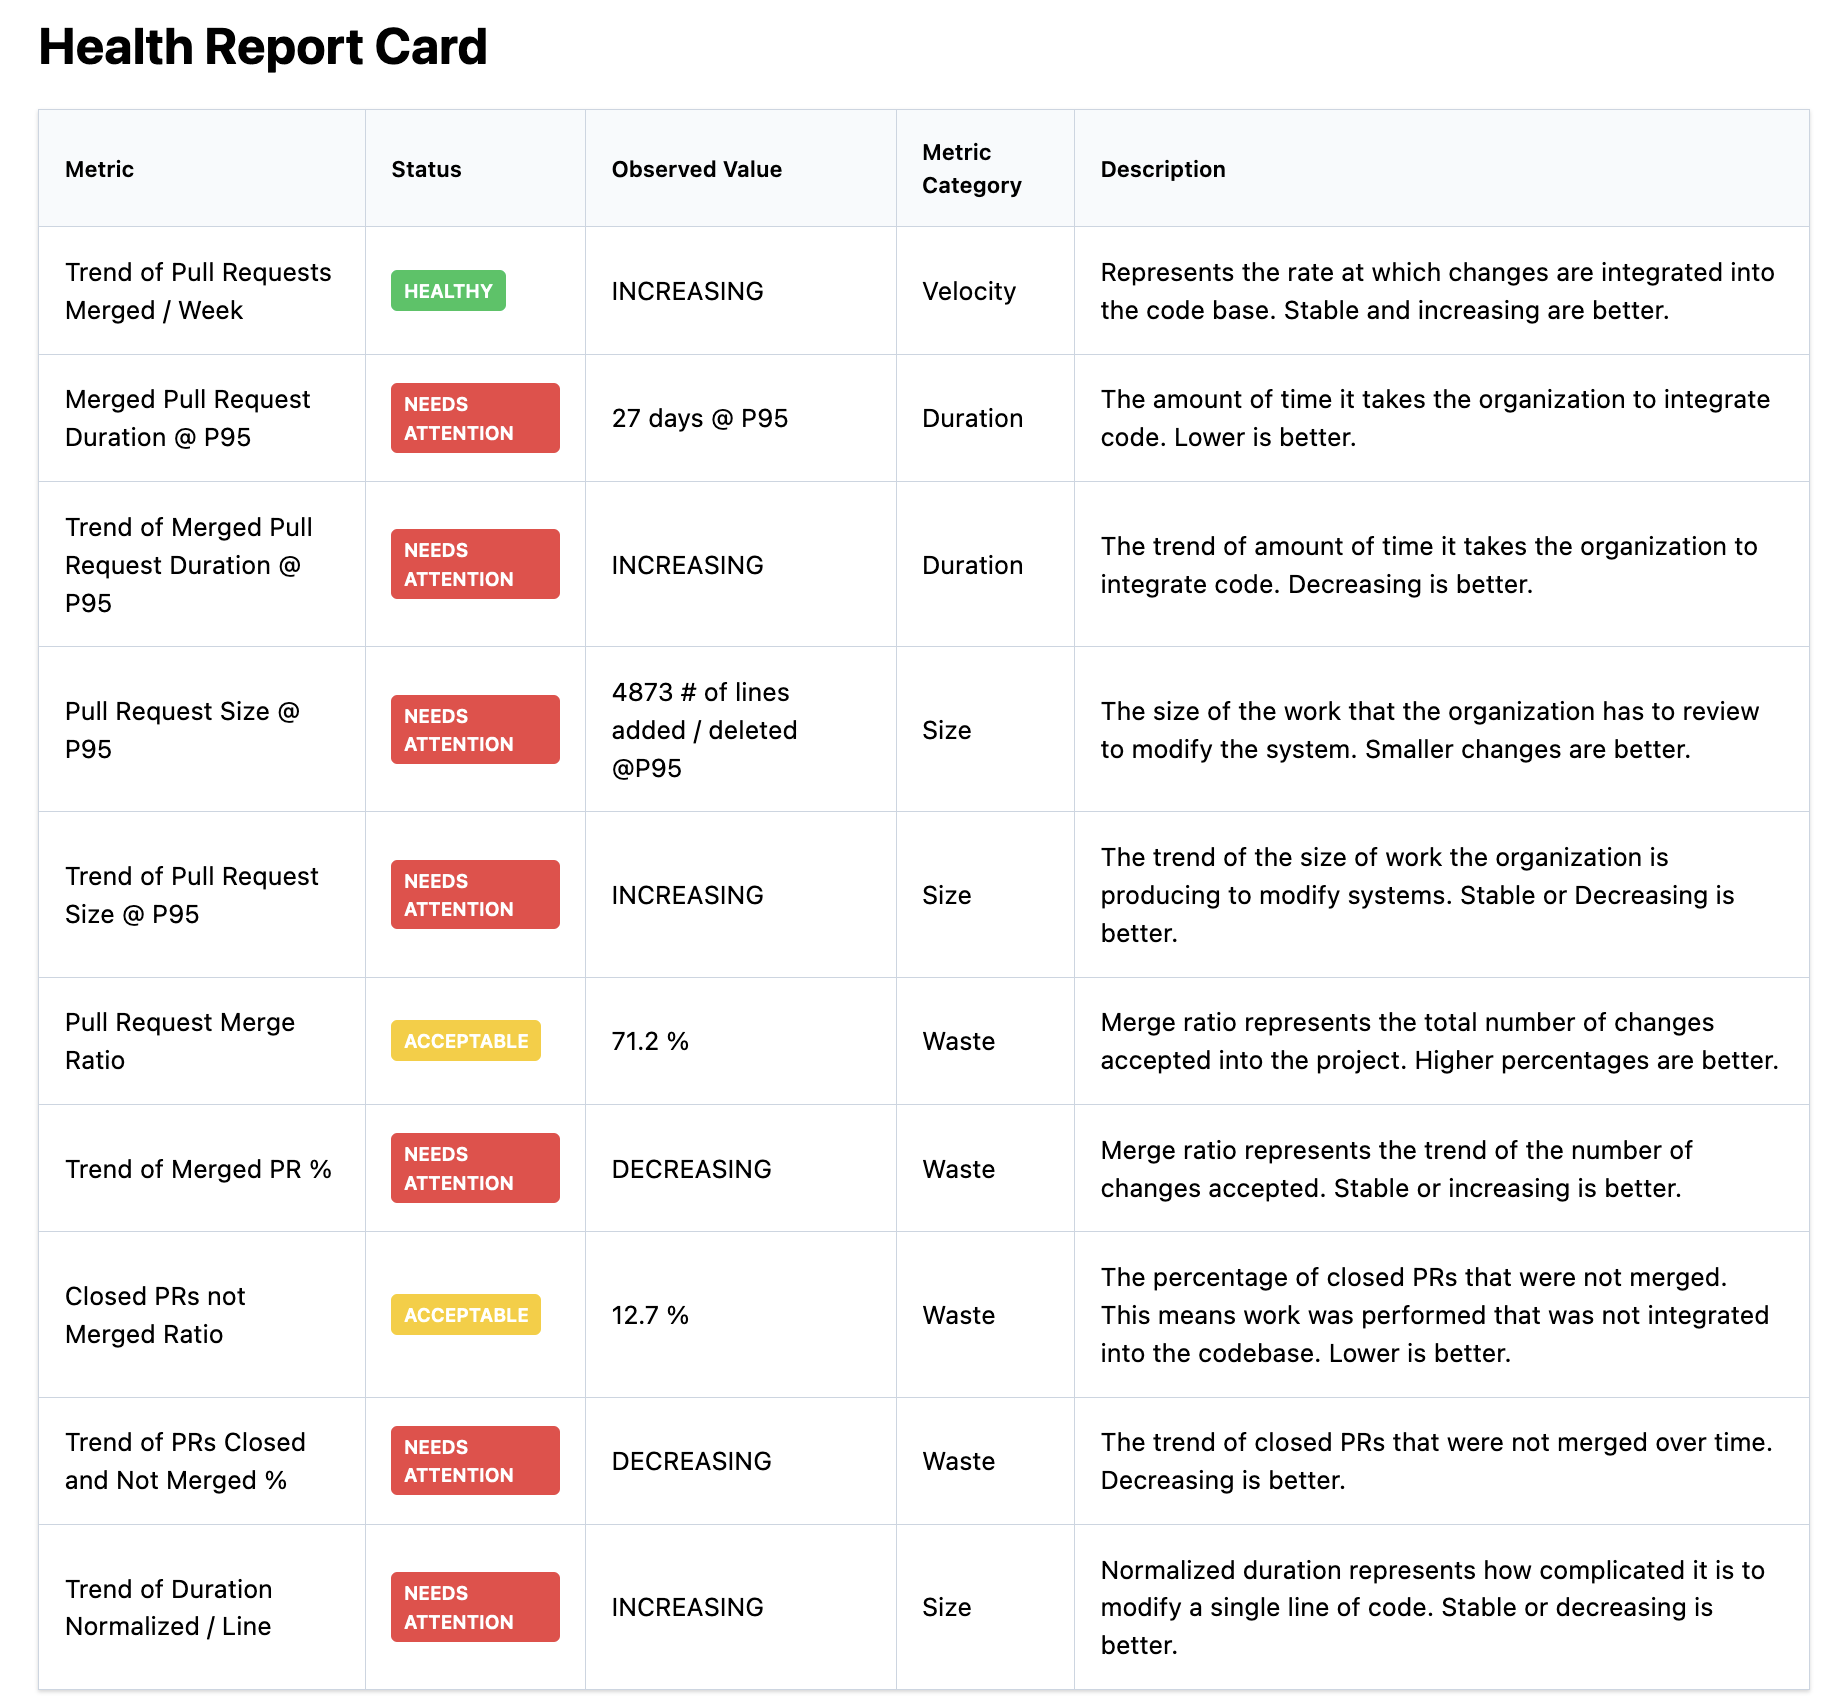
The health report card contains performance indicators, and their associated ratings. Each row represents an individual metric. Each individual metric describes what it's measuring, what it represents, the value observed and a description of the importance of the metric.
Each metric is labeled with a simple Green-Yellow-Red color rating to draw your attention to metrics that need additional follow up and attention.
Insights
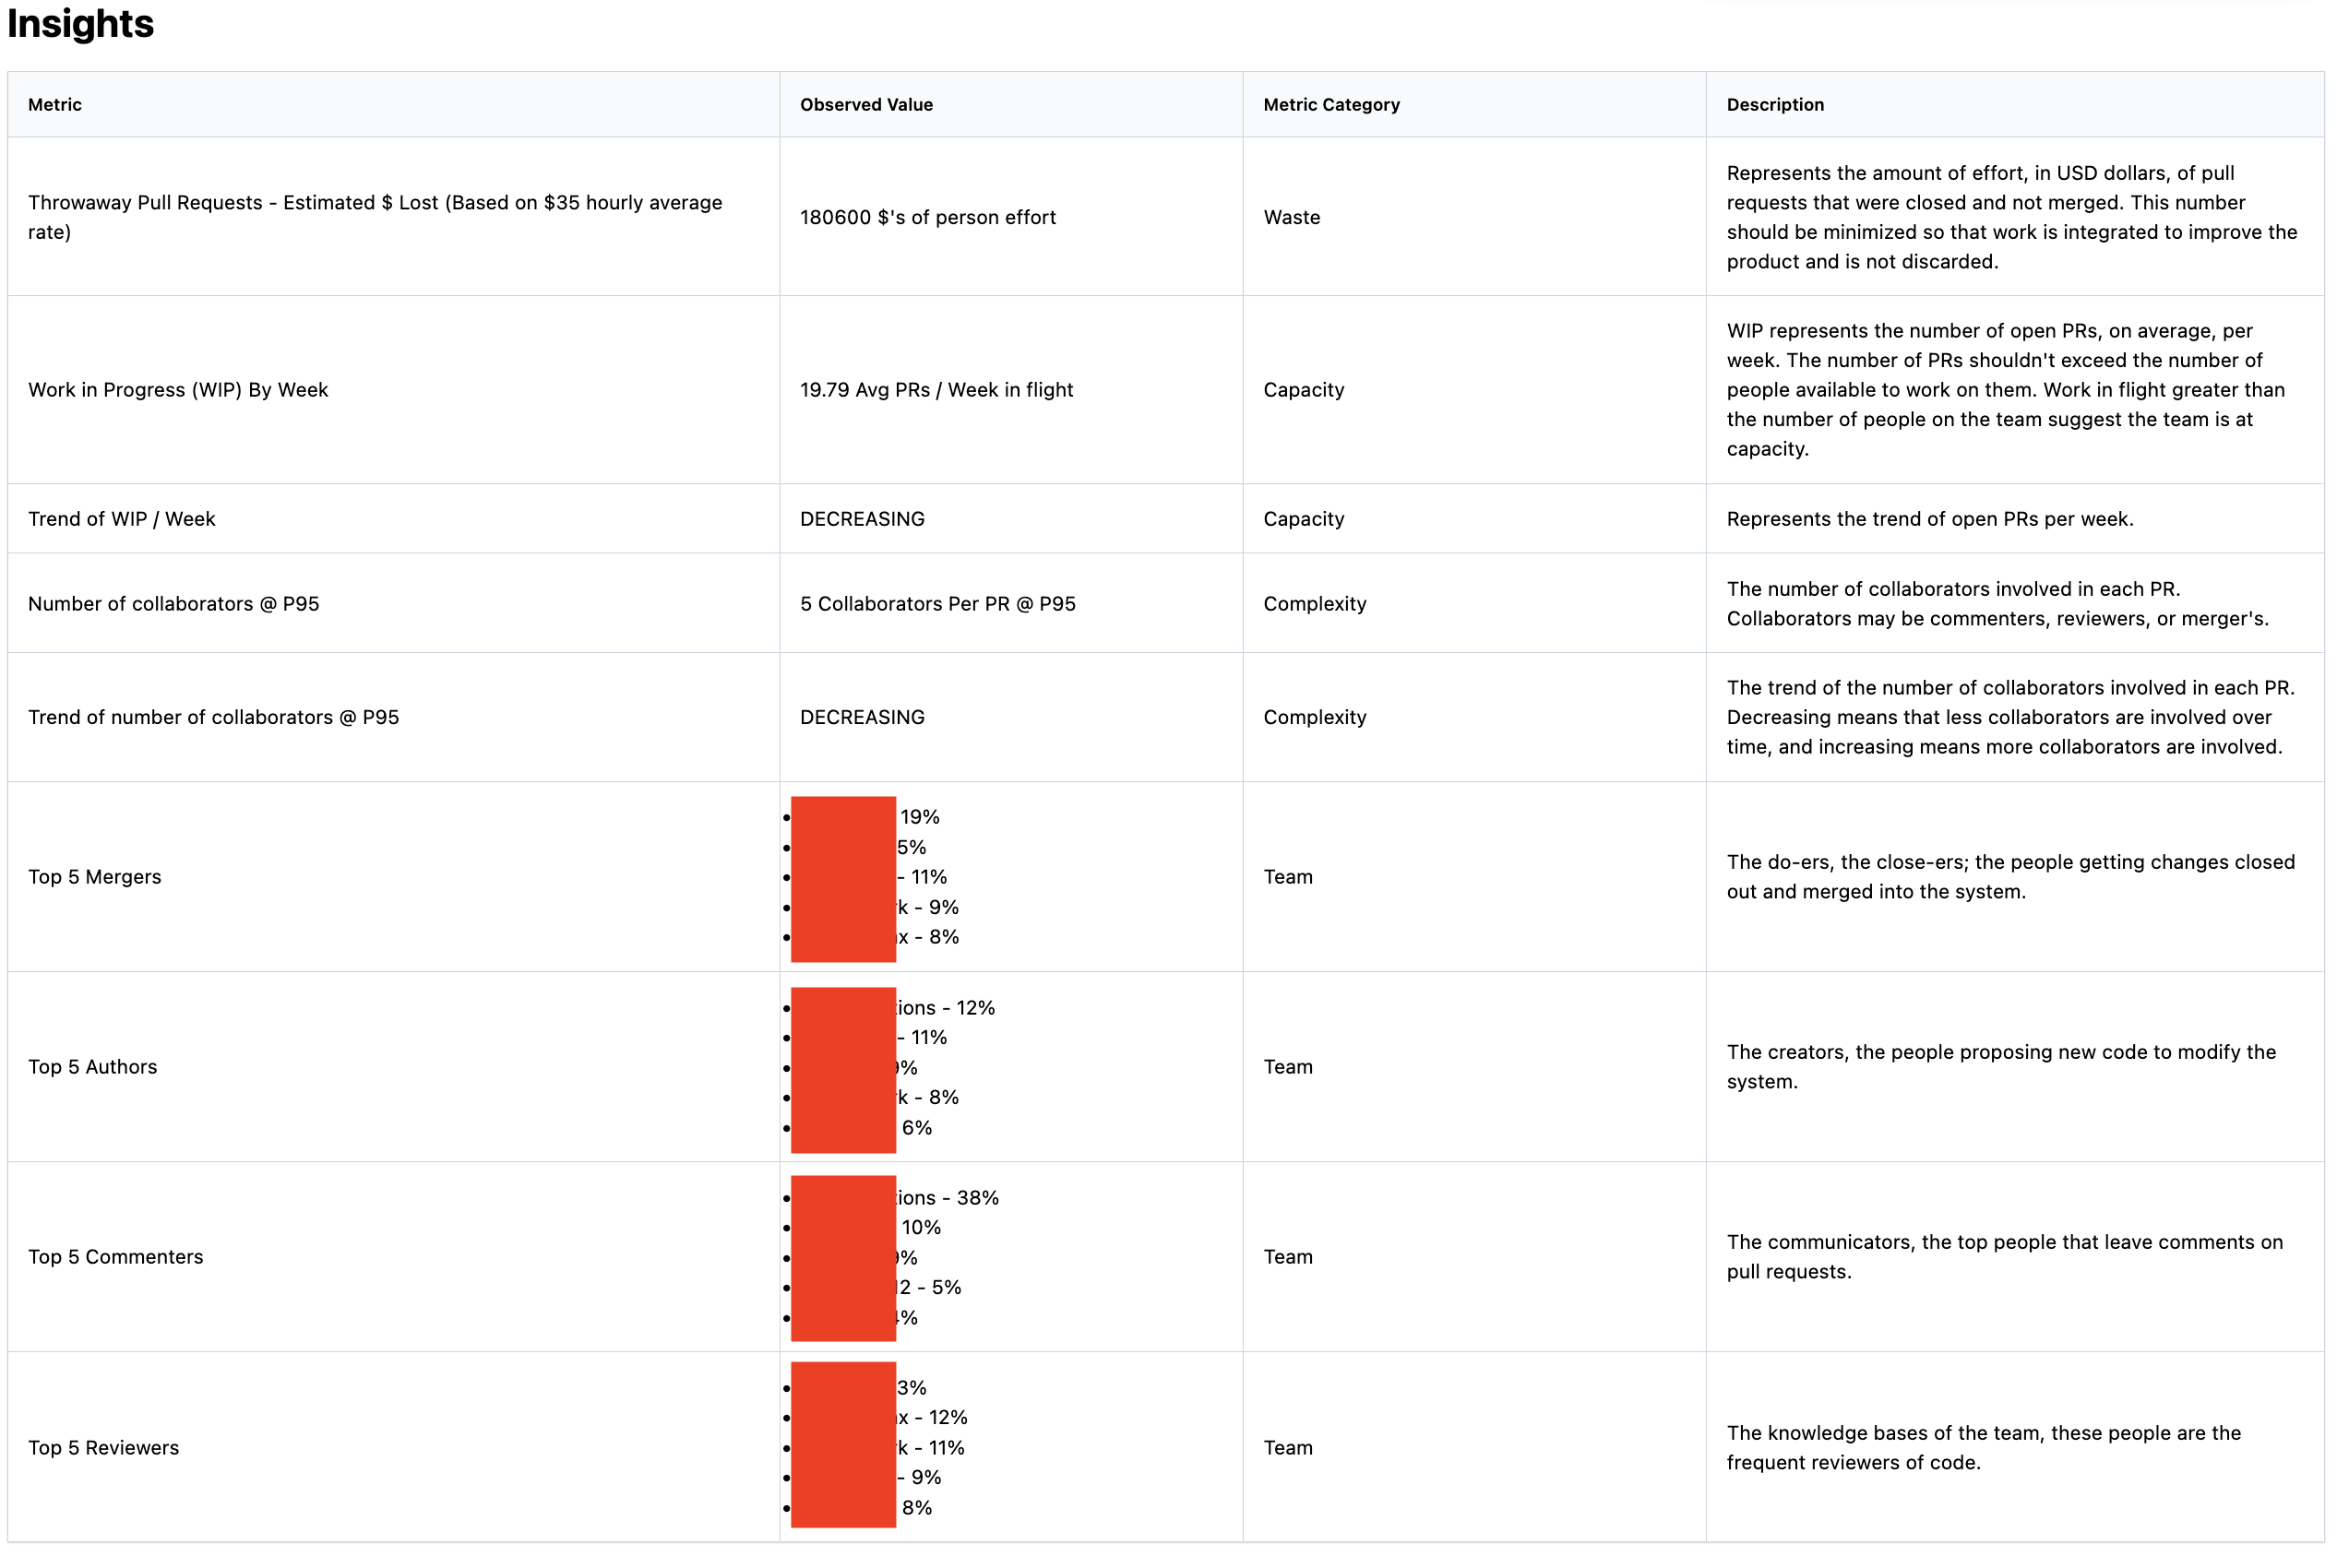
The insights page describes metrics focused on team capacity, work in progress, and the code contributors. Each insight is important to understand, but doesn't lend well to Green-Yellow-Red rating.
Each row represents an individual metric, and contains the measurement description, the metric name the observed value.
Historic Metric Analysis
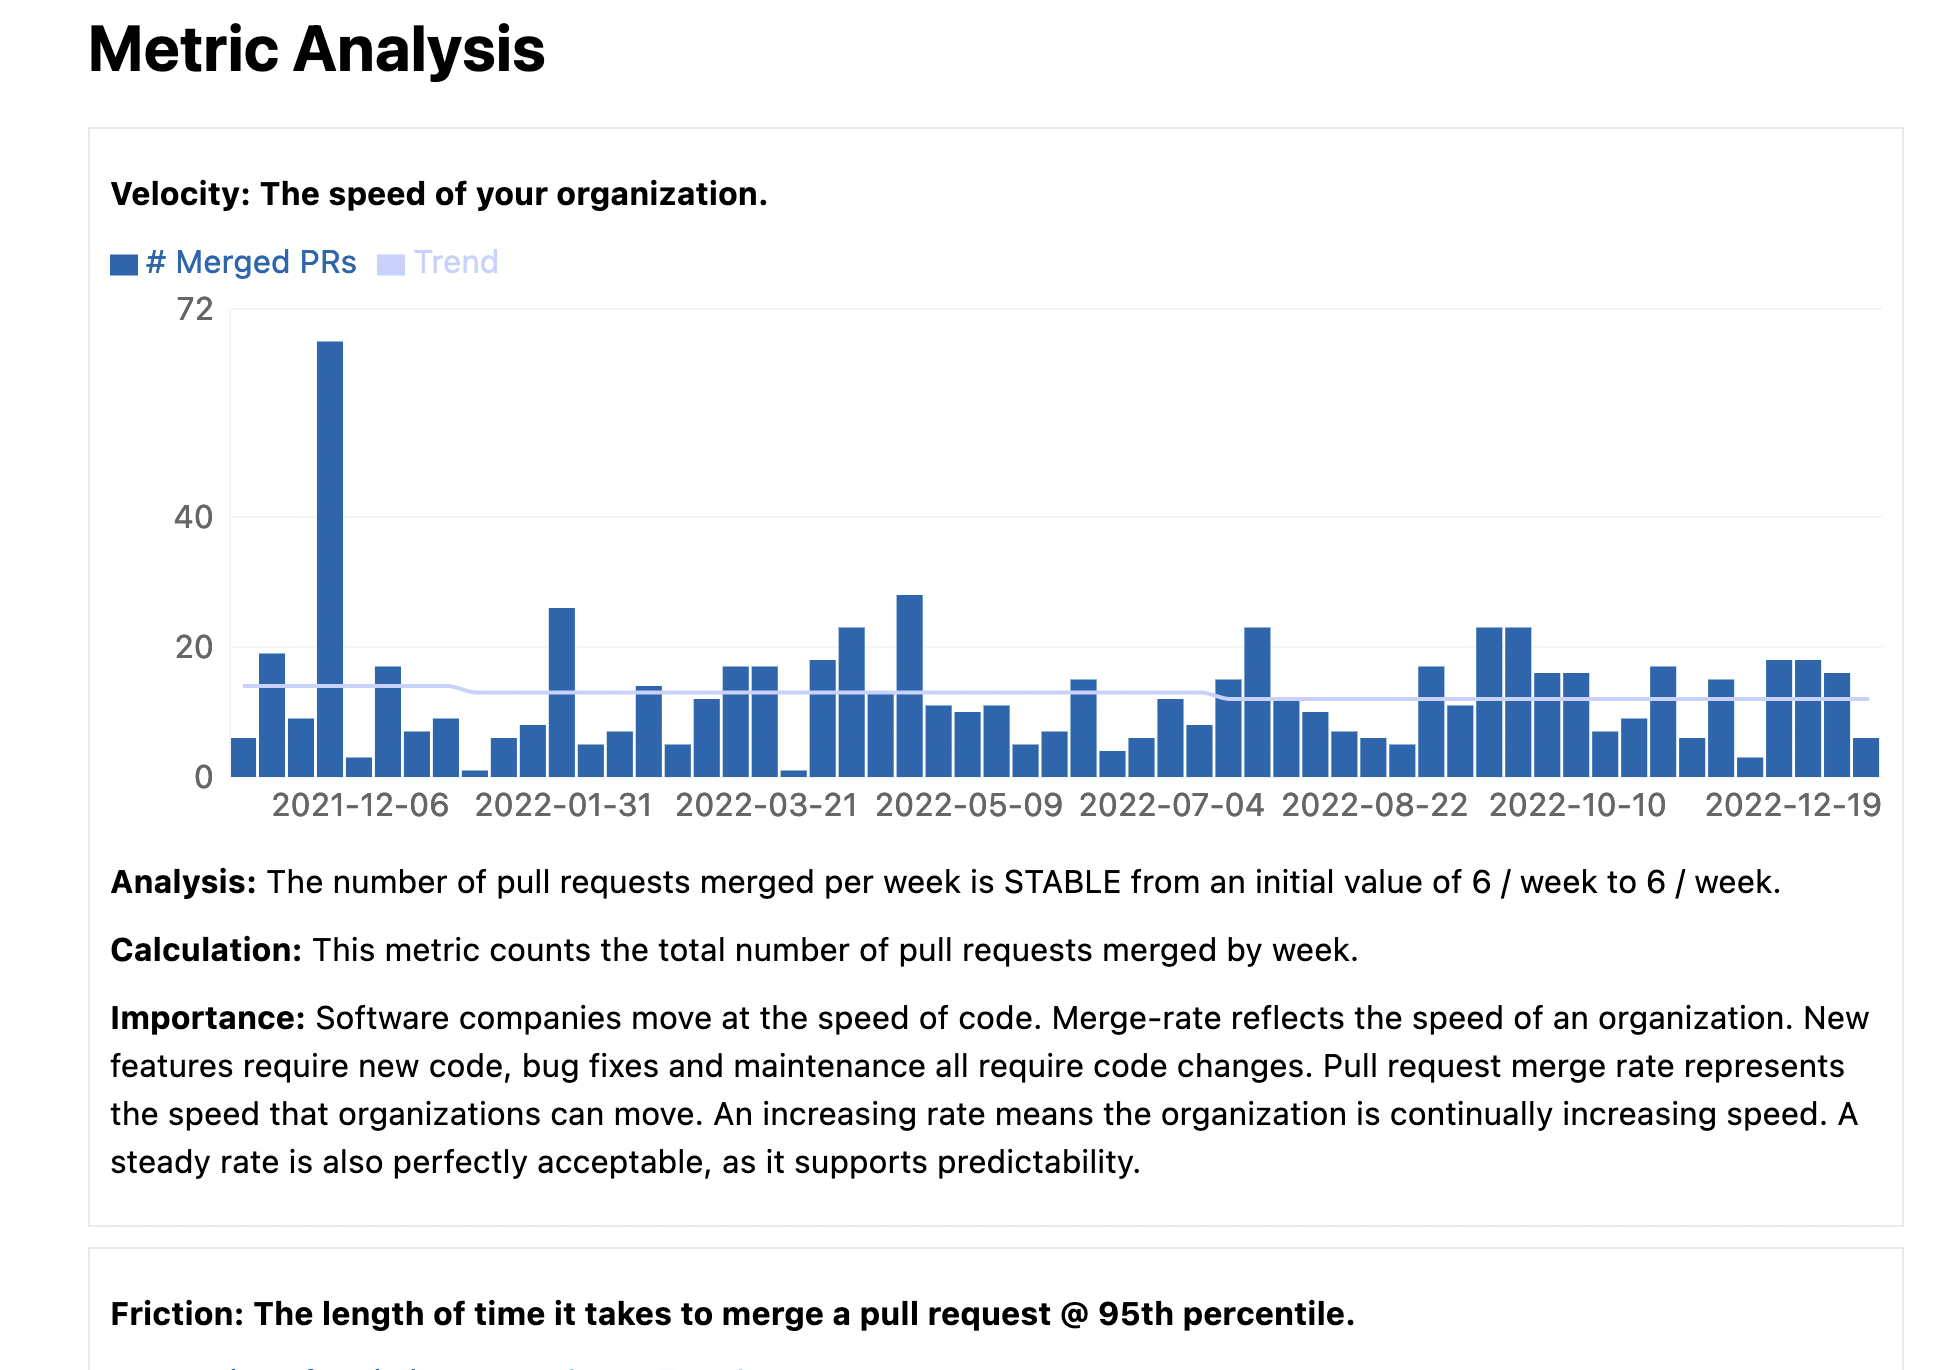
The historic metric analysis section shows metric performance over time, aggregated by week. Each section contains a description of the metric, and outlines why the metric is worth following and how it indicates team health.